Public Awareness Project (General Education, all levels)

This project was used in a general education course on genocide. Throughout the semester, students learn about the stages, starting with how othering creates out-groups, discrimination against those groups, and how that leads to more series action such as persecution before genocide actually occurs.

Students have created some really innovative materials for this project! I love giving them some flexibility to choose the format.

Text of Assignment:

Your group project is a public awareness campaign designed to educate people about a topic relevant to class (it can be very tangentially related to class!).

Students should create something informational that can be easily shared online. Some examples include:

  • Podcasts
  • Flyers
  • Web sites
  • Blog posts
  • Videos
  • … anything else you might think of!

Your issue should focus on something that’s important for the public to know about. This is likely a current event, but could also be something from history about which we know very little (or maybe a new discovery has changed our understanding!).

Students should allocate tasks within their group so that each person has designated responsibilities:

The rubric for this assignment is:

  • Depth of Information Provided: 20 points
  • Quality of Sources (at least three journal articles): 10 points
  • Creativity of Sharing Method: 10 points
  • Grammar/Spelling/Formatting: 10 points

TOTAL: 50 points

Some of the examples created by students:

Poster Presentations (Undergraduate, Upper Level)

The following assignment was used in an capstone course for the Interdisciplinary Studies major in the College of Social Science at MSU. Final posters were presented in a public location on campus (see images below).

For your final course project, each group must construct an interdisciplinary explanation of a specific genocide, using factors from your disciplinary cognates. These factors can be the ones you chose for your disicplinary analysis, or they can be new factors. 

Posters must be uploaded in this Dropbox by April 23rd by 11:59pm.

The poster must be created based on the dimensions of the template linked in this module. Be sure to meet the following requirements for the layout of the poster:

  • There must be an introduction to the issue/event.
  • At least one disciplinary factor must be clearly identified for each member of the group (Anthropology, Sociology, Economics, etc).
  • An interdisciplinary explanation that incorporates ALL disciplinary factors must be presented.
  • Posters are a visual form of presentation, and should not be too text heavy.
  • The posters should be professional, with correct grammar, spelling, and a neat appearance.
  • Posters should include at least one image and one chart or figure with data
  • References should be included on the poster

Your posters will be evaluated using the following rubric:

Poster: Group (90 points):

  • Disciplinary factor identified for each group member: 10
  • Relevance of disciplinary factor to genocide under study: 20
  • Interdisciplinary explanation, combining all factors: 25
  • Image/chart: 5
  • Professional appearance & clarity: 10
  • Grammar/spelling: 10
  • At least five scholarly references: 10

Presentation: Individual (10 points):

  • Attendance
  • Professional appearance
  • Ability to answer questions about your project

Improving Presentations in Quant Classes

I’m currently taking Dr. Echo Rivera’s class on Stellar Presentations, and trying hard to cut down on wordy Power Point slides to enhance learning.

I find it easier to do this in my undergraduate courses, where I can easily use imagery to make my points, but it’s proving more difficult in more advanced courses, such as those I teach to doctoral students on quantitative analysis.

I decided to challenge myself and take an old slide (probably from 2012-ish) and modify it using what I’m learning in Dr. Rivera’s course. So, here’s my starting point:

Screen Shot 2018-08-16 at 4.07.50 PM

BORING!

I began by removing extra words, recognizing that full sentences are not required when you are speaking at the same time as you’re showing the slide. And then it hit me:

I’m speaking at the same time as I’m showing the slide.

So why not create a graphic representation of what I’m trying to demonstrate and then USE MY WORDS to explain the image?

Here’s my first attempt… a work in progress.

Screen Shot 2018-08-16 at 4.36.56 PM

What am I saying at the same time?

We measure multicollinearity by determining the amount of variation in X1 that’s explained by the other independent variables–in this case, X2 and X3.

To do this, we set up a regression equation: x1=a+b2x2+b3x3 and calculate an R-square.

As with a “normal” OLS regression, this indicates the proportion of variation in X1 explained by X2 and X3.

[Point at overlap between X1, X2 and X3. Indicate that X1 is likely the most problematic variable–what happens when it is removed?]

R2 small: little overlap between the variables, VIF & tolerance are close to 1

R2 big: more overlap, VIF increases quickly (no upper limit) and tolerance tends toward zero.

General rule of thumb is that VIF’s over 10 are problematic, but there’s much debate. Look for anomalous values.

(Thinking of moving the equation to the bottom)

Screen Shot 2018-08-16 at 4.46.17 PM

The Current Stage of Genocide in the U.S.

The political scientist Gregory Stanton has studied numerous genocides throughout history, and noticed they all followed similar patterns. They all develop in common ways, although aimed at different groups. After thorough analysis, Stanton has developed 10 stages through which all genocides seem to proceed:

  1. Classification
  2. Symbolization
  3. Discrimination
  4. Dehumanization
  5. Organization
  6. Polarization
  7. Preparation
  8. Persecution
  9. Extermination
  10. Denial

Every country–every society–across the world is currently in one of these stages (although there may be a few countries that might fall at stage “zero” on this list due to high levels of inclusivity/equality).

I believe the United States is currently in the “persecution” stage of genocide (Stage 8).

Stage 1: Classification

In this stage, the society groups their members into “us versus them”. Minority groups are identified by race, ethnicity, religion, sexuality, gender, or another category.  Stanton points out that societies in which these groups do not intermix often are at higher risk of genocide.

Members of out-groups are seen as not being full members of the predominant culture.

Current out-groups in the United States include:

  • Immigrants (predominantly Latino immigrants from Mexico and Central/South America), although Americans have a long history of blaming immigrants for internal problems and have fought to keep them out.
  • African Americans
  • LGBTQ individuals
  • Religious minorities (Muslims, Jews)

How to minimize classification:

  • Recognize commonalities between groups rather than focus on differences. Mutual respect and understanding is key, rather than fearing the unknown or unfamiliar.

Stage 2: Symbolization

Members of “out-groups” are identified by pejorative language, symbols and other methods.

Current methods of symbolization against groups in the United States:

How to minimize symbolization:

  • Public outcry against hate speech and hate symbols is vital, particularly among members of the majority group. Laws can be enacted making these symbols illegal, but this may tread on free speech and should be used cautiously.
  • Some groups have successfully “reclaimed” slurs and thus taken their power (such as the word “queer” has been reappropriated by the LGBTQ community).

Stage 3: Discrimination

Groups are frequently discriminated against with regard to employment, salaries, housing, transportation, and numerous other issues because of their group membership. The United States has been solidly in the discrimination stage of genocide with regard to nearly every minority group living in the country.

Current evidence of discrimination in the United States:

  • There have been a multitude of studies demonstrating racial bias, gender bias, and bias based on gender/sexuality in the academic literature.
  • Discrimination can also take the form of denial of service. Recent examples include denial of service to LGBT individuals (recently upheld as legal in Colorado).

How to minimize discrimination:

  • Put legal protections in place for members of minority groups to ensure equal treatment.

Stage 4: Dehumanization

Members of the group are thought of as animals and treated as such. This facilitates extermination later, as it helps people to overcome the natural human revulsion against murder. The use of propaganda begins in this stage to vilify and dehumanize minority group members.

Current evidence of dehumanization in the United States:

  • Immigrants: The President of the United States has referred to immigrants on several occasions as “animals,” and more recently has stated that immigrants are “infesting” our country.  The current policy of the White House is “catch and release,” a term used in fishing and hunting animals.

How to minimize dehumanization

  • Leaders need to be reminded of the humanity of members of the out-group. Imagery can be a powerful tool at this stage. Examples: “Migrant: Human Being. Citizen: Human Being with a Piece of Paper.”
  • Propaganda needs to be countered with facts–the challenge at this stage is that individuals who believe propaganda are not likely to be swayed with evidence.

Stage 5: Organization

The government starts to organize against minority groups. This frequently takes the form of state support of civilian militias (the Janjaweed in Sudan, for example) so that the government can deny responsibility after the fact.

Current evidence of organization in the United States:

  • Preparation to build a wall on our border with Mexico, even though there is little evidence that Mexican immigrants bring crime into the United States or that Mexican immigrants are more criminal than Americans.


Stage 6: Polarization

The state uses propaganda to polarize the society and gain support for its exclusionary policies. Misinformation and lies are broadcast by the state (frequently on state-owned media), and moderates calling for peace/rationality are removed or forced out. Fear mongering is a common tactic at this stage to increase support for severe measures against out-groups.

Current evidence of polarization in the United States:

  • Misinformation is frequently used by the Trump administration to support its policies.

Stage 7: Preparation

The state begins acting against the out-groups, typically by passing laws outlawing their existence or their geographic freedom. Fear of the victim group continues to be used over state media.

Current evidence of preparation in the United States:

  • Construction of “camps” to hold immigrants that include cages (or as supporters of these policies prefer to call them, “chain-link partitions”).

Stage 8: Persecution

Members of the out-group are separated from the rest of society and incarcerated or placed into camps.

Current evidence of persecution in the United States:

  • In my opinion, it is difficult to argue that holding individuals who have immigrated illegally is a form of persecution; however, removing children from parents while their cases are heard (which can take weeks or months) would seem to be.

Stage 9: Extermination

Members of the out-group are executed and murdered. Thanks to prior dehumanization, this has been facilitated by the belief (by the in-group) that minority group members are no longer human. It is “extermination” rather than “murder” because it is akin to killing an insect or euthanizing an animal.

Warning signs of impending extermination in the United States:

  • Clear extermination would begin if government agents start shooting people at the border.
  • Because civilian militias are often used in in genocide, Americans should watch for reports of killings of immigrants by civilians in border areas (some civilian militias patrol the border and are armed: 2014). This may also occur if there is an increase in killings of Latinos in general, as many people biased against immigrants are also biased against minorities and conflate the two.

Stage 10: Denial

This is always the final stage of genocide, in which leaders deny that (1) anyone has been killed, (2) lies are being spread about killings, or (3) the victims deserved their fate. Evidence is destroyed, “outside forces” are blamed.

In reality, denial occurs throughout the entire genocidal process, but ramps into overdrive after the killings have ended.

Why Is It So Difficult to Say “What Works” with Regard to Gun Violence?

As a criminologist, I try to base my opinions on crime policy around “what works” with regard to findings from academic research. Certainly, there are times I have strong personal opinions about policies… but if the research says they don’t work (or work in a way that I wouldn’t expect), I need to abandon my opinions and stand behind the research.

With regard to gun violence, however, I find myself constantly frustrated by our lack of knowledge on “what works”. There are many opinions online about this, mostly by laypeople who have strong opinions. However, it’s important to note that the research is highly mixed.

The current state of our knowledge on gun violence can be found in the 2005 Report, “Firearms and Violence: A Critical Review“. This report collated dozens of studies and concluded that there is no strong evidence in favor or opposed to most policies.

Like I said… frustrating.

Friends of mine on both sides of the issue pass around data and charts on social media that support their positions, and to them the solutions seem very clear. So, it may be hard to understand why I’m saying that “we don’t know.” And that’s primarily because descriptive charts are only the first step in the data analysis process.

Researchers aiming to establish causality must:

  1. demonstrate an empirical correlation between the cause and effect
  2. confirm that the cause precedes the effect in time, and
  3. eliminate any other potential causes

I’l demonstrate this using a totally made up example (did you hear me, Internet? TOTALLY MADE UP! DO NOT FORWARD AS VALID!).

Let’s say that I live in a state that passed a more stringent background check requirement for gun ownership which took effect on 1/1/2003. I decide to see if this had an effect, so I collect the gun homicide rates in my state for each year between 1994 and 2015, and see what happened.

[NOTE: This is assuming the data I have found are valid and reliable, but that’s an issue for a different post.]

Anyway, I chart my data and it ends up looking like this:

MadeUpData

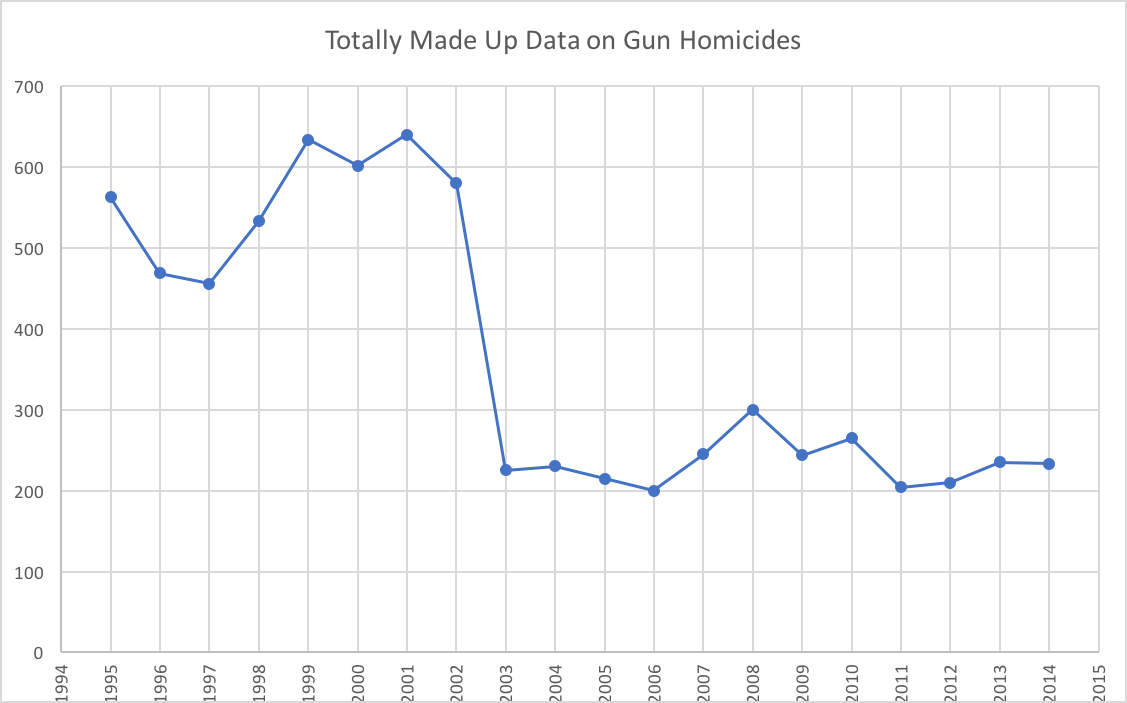
This is pretty compelling information, right? Look at that big drop in gun homicides for 2003! The law must have had an effect!

But hold on…

We have only met Step #1 of the requirement for causality. We’ve demonstrated an empirical correlation–but this does not necessarily mean causation.

Let’s talk about Step #2: determining that the cause precedes the effect in time.

In this example, we might assume that it does, given that the law was effective January 1, 2003. But… how much time should it take the law to have an effect? If a lot of people own guns based on the lenient checks prior to 1/1/03, they still own those guns after the law goes into effect. It’s not like they would just “give them back” if the background check law changes. So, we shouldn’t see such a dramatic drop in one year. That seems fishy.

Changes in the law typically take time to have an effect–but how much? This is something we struggle with when trying to determine the causal ordering. In reality, a law like this might take years to have an effect, but do we really know how many? So maybe as the years tick by, the gun violence rate decreases and starts to tick down… that brings us to:

Step #3: How do we know it’s not really due to something else?

And this is the major sticking point for trying to find an answer. Governments change their laws all the time. New laws are constantly added, old laws are repealed,  wording is changed, amendments are made, AND they usually try to reduce crime by trying several things at once. How could we know which of those things had an effect?

In a perfect world, we would enact a law and watch what happens to crime over several years with no other laws being enacted. But obviously, that’s not possible.

In addition, criminologists struggle to obtain quality data on this issue. In most cases, we haven’t collected it ourselves (i.e., we are dependent on data collected by police departments and other agencies), and there are other variables we’d like to have that aren’t included. Finding that information is very important for identifying those pesky “other potential causes”.

We have statistical methods that allow us to control for other potential causes, but sometimes too many things chance at once and those prove insufficient.

In sum, those simple charts being passed around on both sides only tell part of the story.

I really wish I knew what works here, but I don’t. Criminologists do know some things, however. Just to make you feel better, we can state with confidence that:

  • The death penalty is not a deterrent
  • DARE doesn’t reduce drug use in teens
  • As immigration into the U.S. increases, the crime rate decreases (and also, immigrants commit fewer crimes than native-born Americans)

We know more things, but it’s nice to know a couple of things, at least.

P.S. Many people with strong opinions on these issues frequently engage in cherry-picking–only posting data/articles that support their position and ignoring any evidence contrary to their position. I strongly urge anyone interested in this issue to review all the information and share as much as possible without filters. 

Academic “Social Media” and Copyright

Academic social media sites are becoming commonplace. Referred to as “Scholarly Collaboration Networks,” (SCN’s), sites such as ResearchGate, Academia.edu, and Mendeley.com were all created to allow academics to share their work and network with others in their chosen fields.

One interesting aspect of these sites is the degree to which they encourage the uploading of academic papers to their sites. While this may seem like a good idea, authors who choose to do this may be violating the copyright agreement they signed when the article was published.

Journals disseminate their content through subscriptions, both hard copy and digital. They earn revenue through these subscriptions, and authors who share their published work without permission are (1) violating the agreement of the copyright that they’ve signed, and (2) denying the publisher of their subscription fee.

ResearchGate is currently being sued by Elsevier and the American Chemical Society to stop the uploading of papers to their sites, and it is unclear how these actions may affect authors. Based on agreements signed at publication, authors may be opening themselves up to lawsuits. It is important to understand the limitations of each copyright agreement signed, because different publishers have different expectations.

For example, I recently signed an agreement with Taylor & Francis that contain my rights as an author. With regard to sharing, the agreement explicitly states that I have the right to:

  • freely post the original version of the manuscript that was initially submitted to the journal, prior to review (the AOM: Author’s Original Manuscript)
  • freely post the accepted manuscript (the AM), but not the final version of record (VOR) and that:
    • I “include any amendments or deletions or warnings relating to the article issues or published by us” AND
    • I include the following acknowledgment, “The Version of Record of this manuscript has been published and is available in http://www.tandfonline.com/.”
    • I follow the embargo set forth by some journals for sharing the AM (http://authorservices.taylorandfrancis.com/journal-list/). Their criminal justice journals have an 18 month embargo period.
    • I have permission to upload the final VOR if I paid for open access rights (T&F charges around $2,300 for gold access).
  • share the digital VOR with colleagues (i.e,. single copies via email) or printed version via regular mail
  • share the printed VOR with my students

Wiley has a similar policy, which can be found in this handy image (and similar in concept to the T&F guidelines):

 Screen Shot 2017-10-26 at 4.17.24 PM

Recommendations

Because I rarely use them, I recently deleted my profiles on Academia.edu and ResearchGate. I figured it wasn’t worth the hassle, and it’s unclear whether publishers are going to start suing academics who upload articles without permission.
Scholars looking for a way to highlight their research and publications should investigate Google Scholar (click on “My Profile” to create an account), which contains links to articles as well as access, for those who subscribe. Google Scholar has its issues (double-counting, counting incorrect articles, etc.) but scholars can edit their list of publications and make corrections when needed.
In addition, journals are increasing requiring the use of ORCID‘s in order to uniquely identify authors, particularly those with common names. Registration is free, and this serves as a site for highlighting your work without needing (or being prompted to) upload papers.
Update: I just found this blog post from Nature, in which they surveyed scholars for their views on SCN’s.

Enhancing the Classroom Experience

Last month, I spoke to a group of our faculty about using Facebook for teaching. You can view my class page here, which contains posts relevant to my topic. Students can earn participation points for posting in my classes, and many remain “fans” of the page long after the course is over.

I’ll be speaking in late October at MSU about the “Flipped Classroom“, in which the traditional lecture model is abandoned in favor of hands-on learning. Rather than using class time for lecture, students come to class having completed pre-class activities (the reverse of homework). Class time becomes available for students to work collaboratively or independently on projects, with the instructors providing help as needed.

Finally, I’m assisting with several faculty efforts developing new courses using the backward design model. Instructors interested in this topic might want to review the following books:

Creating Significant Learning Experiences, by L. Dee Fink

Understanding by Design, by Grant Wiggins and Jay McTighe